MikroTik Bandwidth and Resource Monitoring with Graphs
“Am I getting my committed bandwidth?” is a common question to any network administrator. This question may arise either from your customer or from your owner if you are an employee of any organization. If you feel boring hearing this question and want to establish a system where your customer will be able to inspect his bandwidth usage, MikroTik Graphing is your best friend. MikroTik Graphing can be used to display graphics for traffic which is passed through interfaces and simple queues as well as for resource usage (CPU, RAM and Disk usage). MikroTik Graphing method first records bandwidth or resource usage information on memory or on the device’s storage with a time basis and then displays this information in an easy to read graph that can be printed or the web link can be given to a client for his or her own inspect ion. But before getting these graphs available in your Winbox or web interface, you must first configure MikroTik Graphing properly. In this article, I will explain how to configure MikroTik Graphing for recording MikroTik bandwidth and resource usage information and displaying recorded information in an easy to read graph through Winbox or the web interface.
MikroTik Graphing Configuration to Record Bandwidth and Resource Usage
Before getting MikroTik bandwidth and resource usage graphs available in winbox or web interface, we have to configure MikroTik Graphing first. MikroTik Graphing is able to display graphs for
- traffic which is passed through interfaces,
- traffic which is passed through simple queues and
- CPU, RAM and Disk usage.
So, in Graphing we need to configure Interface Rules, Queue Rules and Resource Rules which will record traffic and resource data and display graphs in winbox or web interface. The following sections will show how to create interface, queue and resource rules in your MikroTik Graphing.
Creating Interface Rules to Record Interface Traffic
Interface Rule is responsible to record and display interface traffics graphically. The following steps will show you how to create Interface Rules in MikroTik Graphing.
- Login to your MikroTik Router and go to Tools > Graphing menu item. Graphing window will appear.
- Click on Interface Rules tab and then click on PLUS SIGN (+). New Interface Graphing Rule window will appear.
- Choose your desired interface, which traffics you want to view graphically, from Interface dropdown menu. If you want to view all interfaces’ traffic, select all from Interface dropdown menu.
- Put your desired IP Address or Network, which is allowed to view this interface graph in webpage, in Allow Address input field. If you don’t provide any specific IP Address, all IP Addresses will be able to view this interface graphs.
- Click on Apply and OK button.
First Interface Rule for Graphing has been completed. Similarly, you can create as many Interface Rules as you want and can view traffics graphically.
Creating Queue Rules to Record Queue Traffic
Creating Queue Rules, you can view any simple queue traffic graphically and you can also send this graph link to your customer for his inspection. The following steps will show you how to create Queue Rules in your MikroTik Graphing.
- In Graphing window, click on Queue Rules tab and then click on PLUS SIGN (+). New Queue Graphing Rule window will appear.
- Choose your desired simple queue, which traffics you want to view graphically, from Simple Queue dropdown menu. If you want to view all simple queues’ traffic, select all from Simple Queue dropdown menu.
- Put your desired IP Address or Network, which is allowed to view this simple queue graph in webpage, in Allow Address input field. If you don’t provide any specific IP Address, all IP Addresses will be able to view this simple queue graphs.
- Click on Apply and OK button.
First Queue Rule for Graphing has been completed. Similarly, you can create as many Queue Rules as you want and can view traffics graphically.
Creating Resource Rules to Record Resource Information
MikroTik Graphing gives facility to monitor CPU, RAM and Disk Usage graphically but Resource Rules must create to view this graphs. The following steps will show you how to create Resource Rules in your MikroTik Router.
- In Graphing window, click on Resource Rules tab and then click on PLUS SIGN (+). Resource Graphing Rule window will appear.
- Put your desired IP Address or Network, which is allowed to view resource graph in webpage, in Allow Address input field. If you don’t provide any specific IP Address, all IP Addresses will be able to view this resource graphs.
- Click on Apply and OK button.
Resource Rule has been created successfully. Now it is possible to monitor your MikroTik Resource (CPU, RAM and Disk) usage graphically.
How to View Recorded Bandwidth and Resource Graphs
Bandwidth and Resource Graphs can be viewed through winbox or the web interface. Your customers are only eligible to view graphs in web interface. The following section will show how to view
- Bandwidth usage and
- Resource usage graphs that are created by MikroTik Graphing Tool.
Viewing Graphs through Winbox
Your winbox is eligible to view your bandwidth and resource usage graphs. So, you can view your interface graphs, queue graphs and resource graphs whose rule you created before in your Winbox. The following steps will show how to view graphs through your winbox.
- Go to Tools > Graphing and then click on Interface Graphs tab. Your created interface rules will be available here. Click on your desired rule twice. Your desired graph will appear where you can inspect your traffic which is passed through this interface.
- Now click on Queue Graphs tab. Your created queue rules will be available here. Click on your desired queue whose bandwidth you want to inspect. You will get your desired bandwidth usage report graphically.
- Again, click on Resource Graphs tab and click on your desired resource (CPU, RAM or Disk) twice and you will find your resource usage graphs now.
Viewing Graphs through the Web Interface
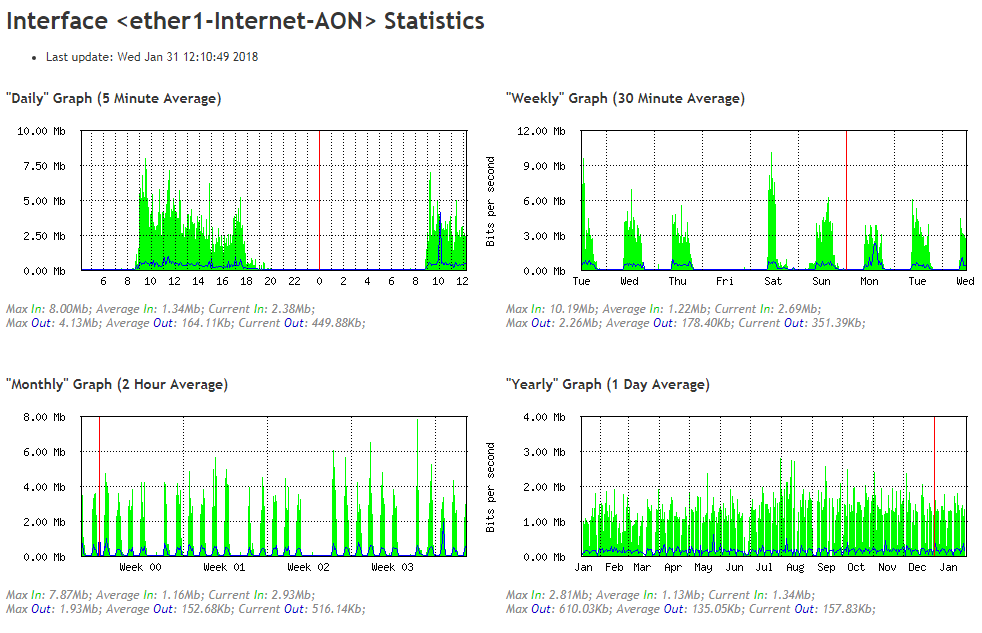
The best and suitable method to view your bandwidth and resource usage graphs through web interface. Your created graphs will be found at https://[Router_IP_address]/graphs. You can also send this URL to your customer and he/she can view his/her accessible bandwidth usage graphs from this URL. An interface bandwidth usage graphs looks like below image.
You can easily configure MikroTik Graphing Tool to monitor bandwidth and resource usage if you follow my above steps properly. However, if you face any confusion, feel free to watch my video about MikroTik bandwidth and resource monitoring with graphs. I hope, it will reduce your any confusion.
How to View Bandwidth and Resource Usage Graphically with MikroTik Graphing has been explained in this article. I hope, you will be able to create and view your MikroTik bandwidth and resource usage graphs easily following my steps properly. However, if you face any confusion, feel free to discuss in comment or contact with me from Contact page. I will try my best to stay with you.
Why not a Cup of COFFEE if the solution?

How can I share bandwidth configuration in PPPoE server
When a user is connected with pppoe server, a dynamic interface is created for that user. So, if you create static pppoe interface for a user and then create interface rule in graphing tool for that interface, you can show and share user bandwidth graphing tool monitoring this interface bandwidth.